Free Data (Uniswap Pt. 3 + The Graph Pt. 1)
An introduction to the graph using Uniswap V3 data
Real numbers
In my exploration of Uniswap I've given some broad numbers as well as some quotes from online tools on what APYs to expect as well as current quotes and historical price charts. For APY estimations I was using Metacrypt and for historical prices I was using Yahoo finance. Ultimately this is trusting those sources to be correct and assigning those whatever values we get to our individual use case.
For Yahoo Finance they have an easy to use API with a built in reader in the padas_datareader library for Python. It makes getting data for $SPY, $TSLA, $GE, $BTC, $ETH, and even $SHIB easily done with just changing the ticker. But all of these are measured in USD, feature no volume numbers, and are only daily close prices. If you want to get more granular than that or natively get the SHIB/ETH price it would appear it's not so easy.
The protocol “The Graph” has software and a network of incentives for users to build a GraphQL API that can access indexed data from a number of chains. The team at Uniswap Labs have done just that for V3 allowing users to access more human readable data from the Uniswap V3 protocol and build their applications on top of it.
Graph —> Subgraph
The Graph is the overall protocol providing the tool to build subgraphs as well as the incentive structure to Index and Curate subgraphs for any smart contract on a number of EVM chains as well as Gnosis, Moonbeam, and a few others in beta. Given my previous descriptions of Uniswap V3 I will be showing how we can get data from the Uniswap V3 subgraph in order to better inform backtesting and our investment decisions in Uni LPs.
We can start by acknowledging some of the properties we've used thus far in our research like Liquidity, Ticks, and prices. All of these properties are accessible in the subgraph as they are defined in the Uniswap V3 Whitepaper and they are (importantly) indexed, meaning the change in these values through time is as easily accessible. Since we now have a better understanding of these V3 specific concepts we can now also access real historical values rather than assume some approximations.
Indexes == History ≈ Future
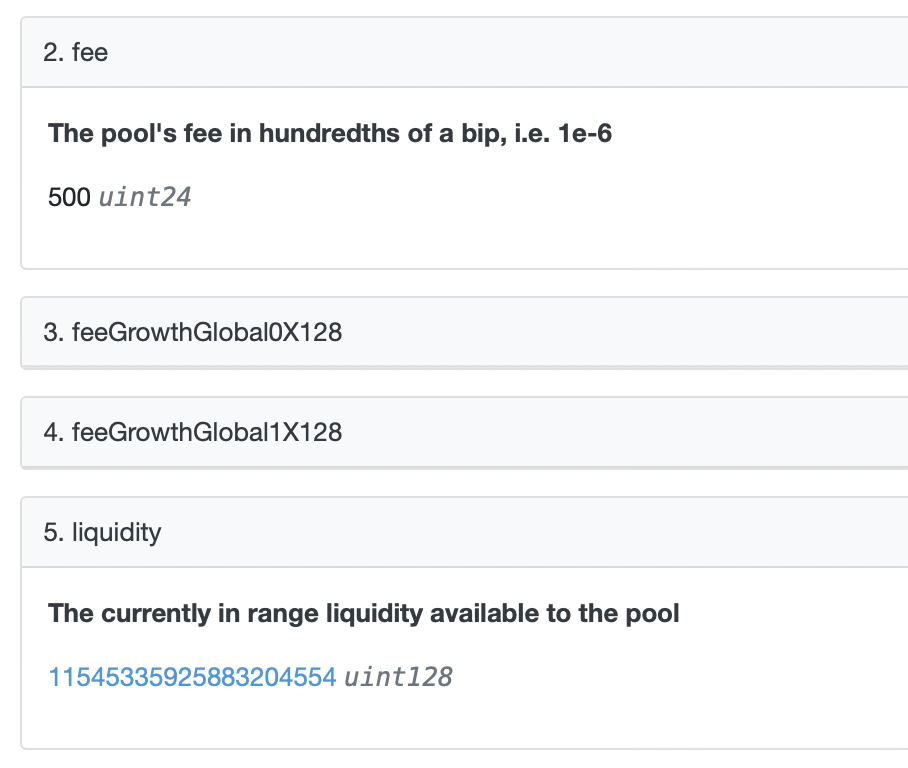
Getting the state of the current Ethereum (or other) blockchain has been relatively trivial. For Uniswap we can even go to the contract of the pool we're interested in and read the state right from etherscan as we can see from the properties right here.
With the indexed history we can get price data right from the indexed contract itself rather than from yahoo finance. This enables us to get the real ETH/USDC price rather than USD price from wherever Yahoo is sourcing. This is also especially helpful when we want to see something like the ETH/WBTC price or ETH/SHIB and not compare two price series against the dollar. (Efficient markets being efficient I know this will unlikely result in any meaningful discrepancy, it's just better to get the data right from the source rather than a centralized intermediary)
Price is the simple one, but since we're experts at the “liquidity” value from our previous math lessons we can also see current liquidity granularity as well as historical liquidity. Having this historical liquidity we can make better estimates about future yields by making more accurate backtests.
But first we have to get this data.
Querying with the GraphQL Query Language
Yes, QL stands for Query Language.
I won't walk through the intricacies of GraphQL (the GraphQL foundation has great resources) but I'll provide some examples so anyone can jump start using this data. The Graph “explore” page is typical of a public GraphQL API where we can build queries and see some documentation on the values and filters. Creating a query right in the builder or explore page is very helpful when we're starting out.
Let's start with what a query would look like to get price data for a set number of days? First we need to find the pool we want to query. We can just know that address of the pool or query the the subgraph to find it. Let's do that first. We'll get a list of pools with USDC and WETH as their tokens and then retrieve the addresses and the fee tiers in order to differentiate them.
query usdc_weth_pools {
                pools(where: {token0: "0xa0b86991c6218b36c1d19d4a2e9eb0ce3606eb48",
                    token1: "0xc02aaa39b223fe8d0a0e5c4f27ead9083c756cc2"},
                    orderBy: volumeUSD, orderDirection: desc){
                  id
                  feeTier
                  volumeUSD
                  txCount
                  feesUSD
                  token0 {
                    id
                    name
                    symbol
                  }
                  token1 {
                    id
                    name
                    symbol
                  }
                }
              }
As you can see, in GraphQL you request just the information you want and that's what you receive back. If you run this query in the GraphQL playground you can see the answer right next to it and confirm plenty of the information.
We can confirm here that the 5 basis point pool has the most volume so we can focus in on that pool at address 0x88e6a0c2ddd26feeb64f039a2c41296fcb3f5640.
Now we know what pool we're querying we want to see what information we should get. Let's get daily prices and liquidity for the past 365 days. The pool object in the subgraph has a daily stats value where we can see all of that information. That query would be the following:
query pool_stats ($pool: String, $days: Int) {
                pool(id: $pool){
                  poolDayData(first: $days, orderBy: date,
                  orderDirection: desc){
                    date
                    token0Price
                    volumeUSD
                    feesUSD
                    liquidity
                    txCount
                    open
                    high
                    low
                    close
                  }
                }
              }
variables:
    {
    "pool": "0x88e6a0c2ddd26feeb64f039a2c41296fcb3f5640",
    "days": 365
    }
Yes I did sneak some query variables in on you, this makes the query much more flexible and dynamic if you want to expand on it.
Ok that's pretty neat. Now we have all the data we requested in a handy dandy JSON from the largest decentralized liquidity source for USDC/ETH. For free*.
*It's free now but once the hosted service is sunset you will have to pay for this in GRT, likely less than a cent for this info.
Rather than using the explore page from The Graph is we go direct to the endpoint of the API in a web browser we get a better builder page where we can even use variables like I had in the previous query.
Chart time
Now what can we do from the very simple information pulled. Well we can make some price and volume charts if we want.